Closing the Token Gap
Mobile apps gained attention and user adoption before they figured out how to monetise, but in the end the revenue model was simple: as Mark Zuckerberg said to Orrin Hatch in 2018,
“Senator, we run ads.”
This revenue lag manifested in a delta between the proportion of time spent on each platform (print, radio, TV, web, mobile) and the proportion of advertising spend on each platform. This delta was captured by Mary Meeker, the securities analyst and venture capitalist, in the iconic "Meeker Chart".
Meeker had been publishing annual reports on tech trends since 1996, but as early as 2011, Meeker argued that this delta would close - and hence she was long mobile ads. The money would follow the attention. Her 2011 Kleiner Perkins annual report argued that there was a $20B opportunity in mobile and web advertising.
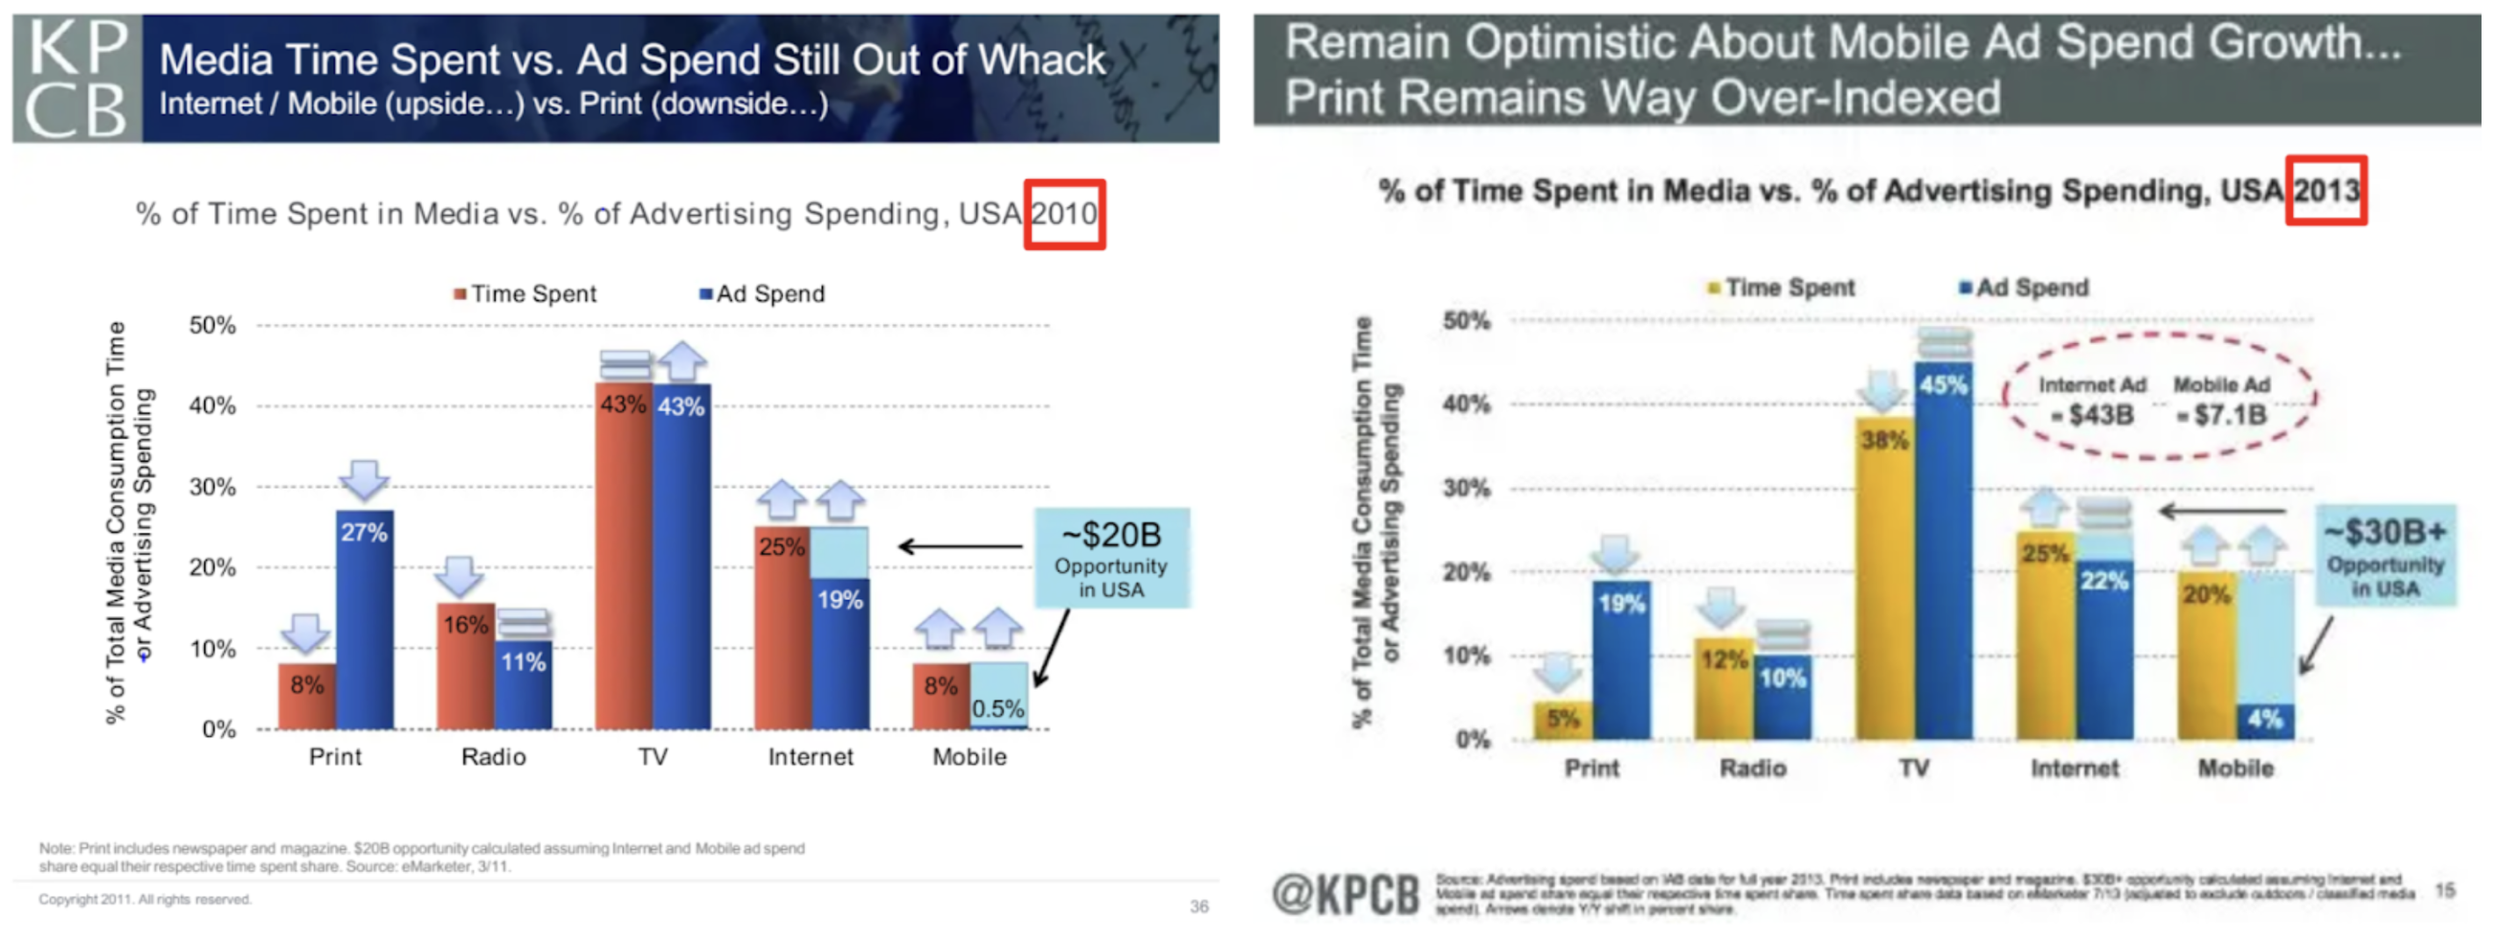
Some people disagreed. But Meeker was stunningly right; by 2018, the gap had closed.
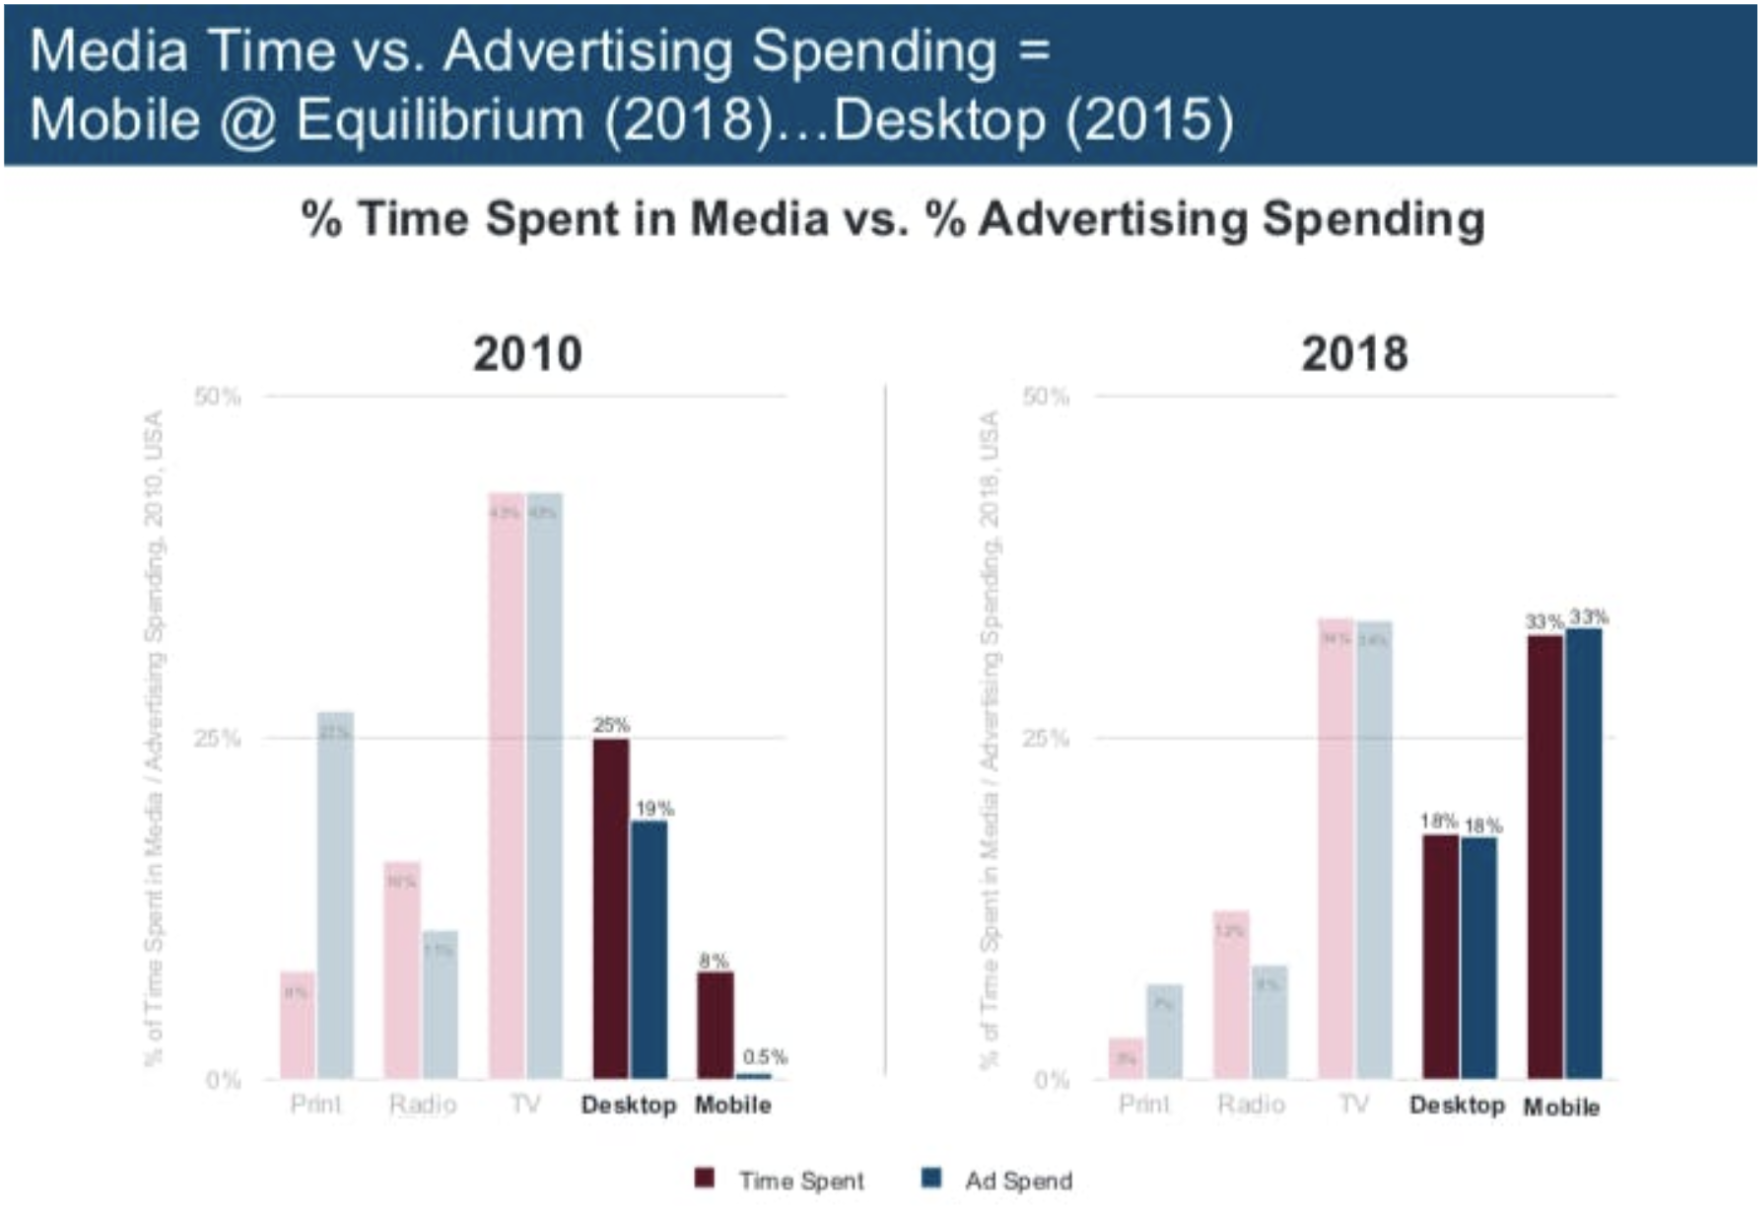
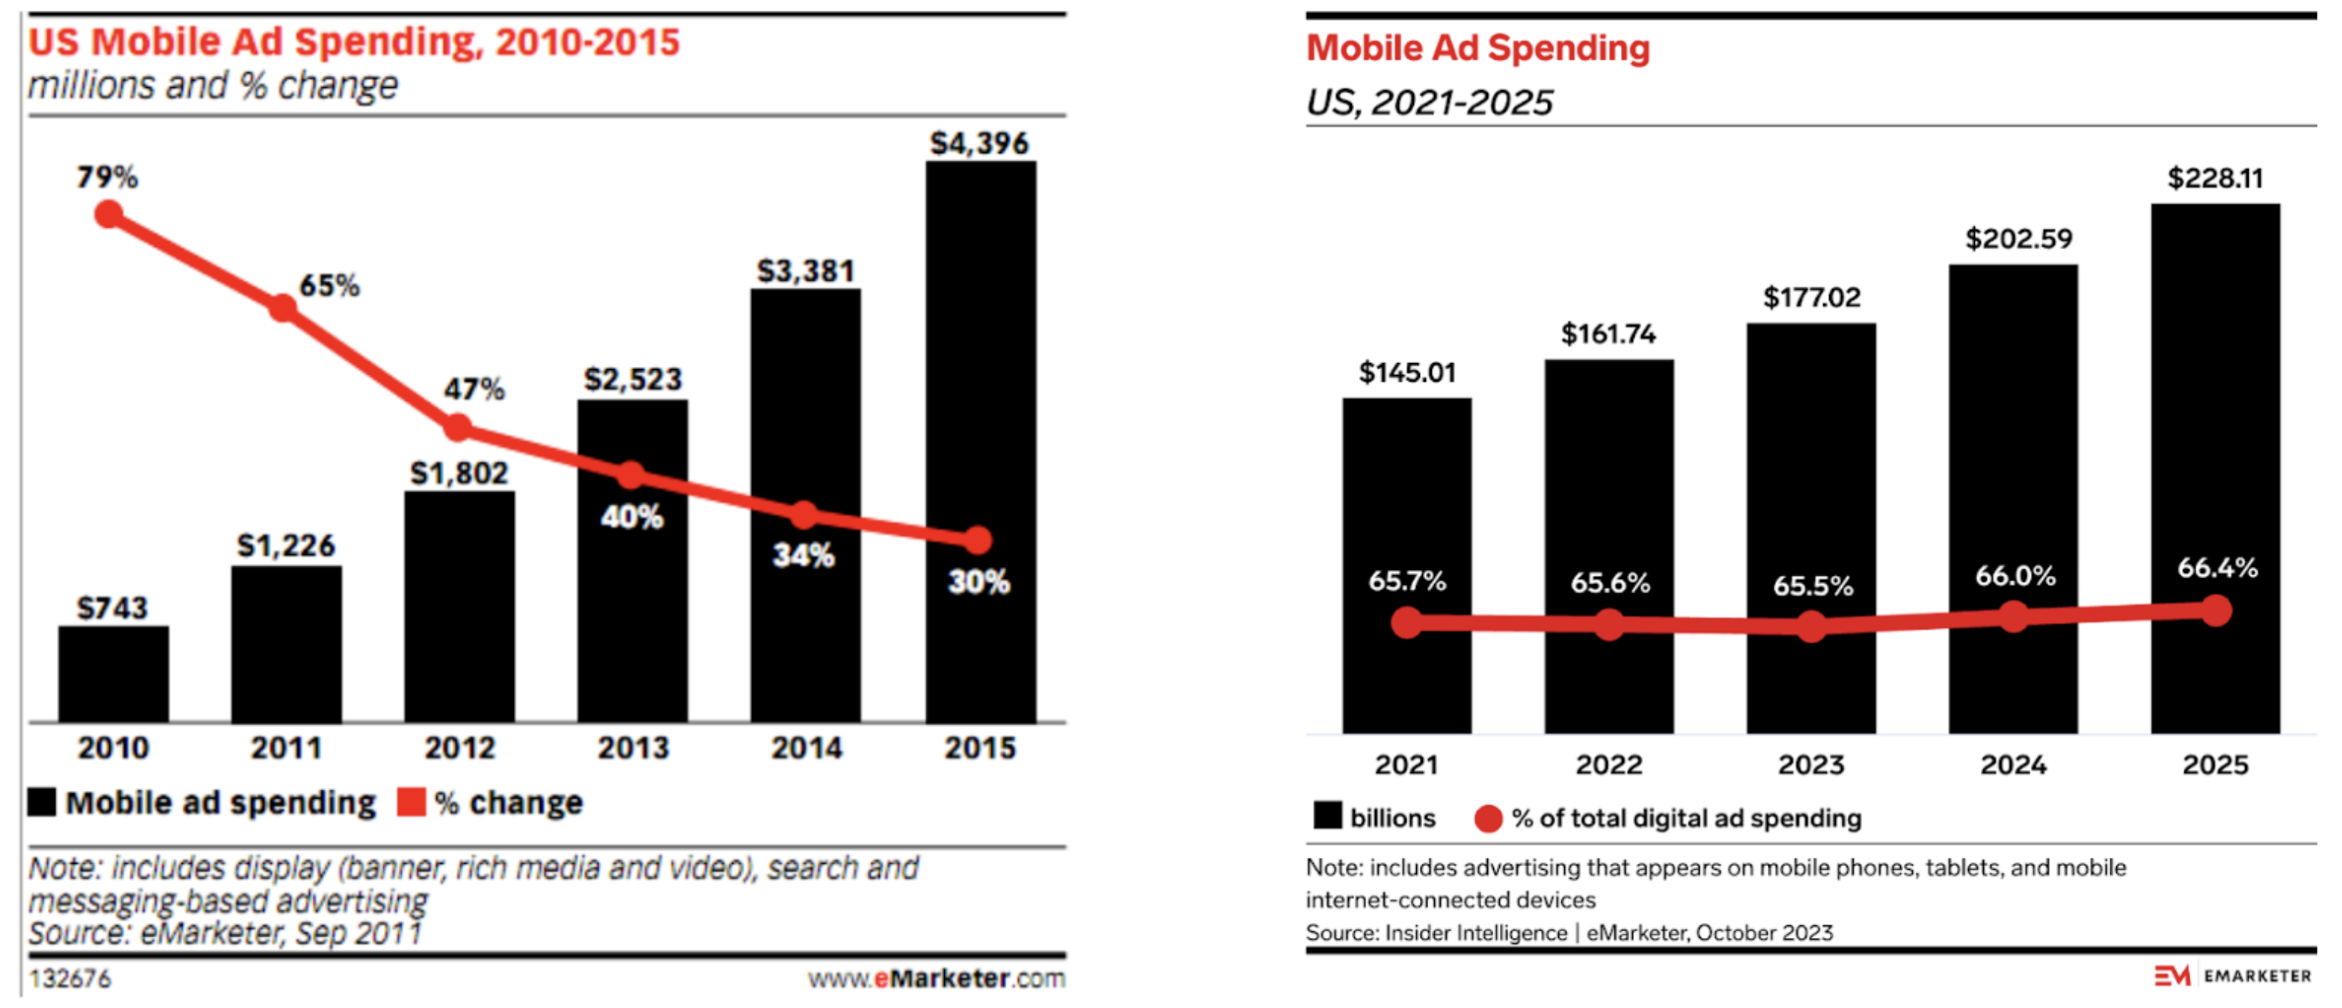
In fact, she underestimated the opportunity. Mobile and web advertising became massive. US mobile advertising spend was roughly $600 million in 2010; by 2024, it was over $200 billion.
We could adapt Meeker's analysis for AI in two ways. The obvious approach is to add “chat” as the sixth medium in her graph; but a more interesting approach would be to contrast labour costs with token costs across industries, and argue that these delta between these two costs will contract.
It follows from the first approach that since attention has shifted from websites to chatbots, ad dollars will follow. Many startups are working on this; OpenAI has hired (by some accounts, a rather sclerotic) team from Facebook to run their ads business; Anthropic launched a Super Bowl strike that was pre-emptive enough to be worthy of Pete Hegseth. All the analysts that made their careers by betting on ads being important are, shockingly, predicting that ads will continue to be important.
I agree. OpenAI will monetise through ads, because people hate paying for stuff. But there are more interesting things to say here.
Instead, we could compare token spend to white collar labour cost, sector by sector, across the entire economy. The key point is that today software engineering consumes a massively disproportionate share of tokens; but as AI in other sectors catches up, the deltas between labour share and token share in different parts of the economy will shrink. In every sector except software, Token costs will go up, wage bills will go down, and productivity will increase.
If we did this comparison, we’d be able to see where AI is being deployed into the economy - exposing misallocation, product-market fit, and opportunity. But the problem is that nobody - not even the model providers themselves - know the true distribution of token spend across industries.
Working with public data on wages and tokens, and focusing on “white collar work”, one can produce something like the graph below:
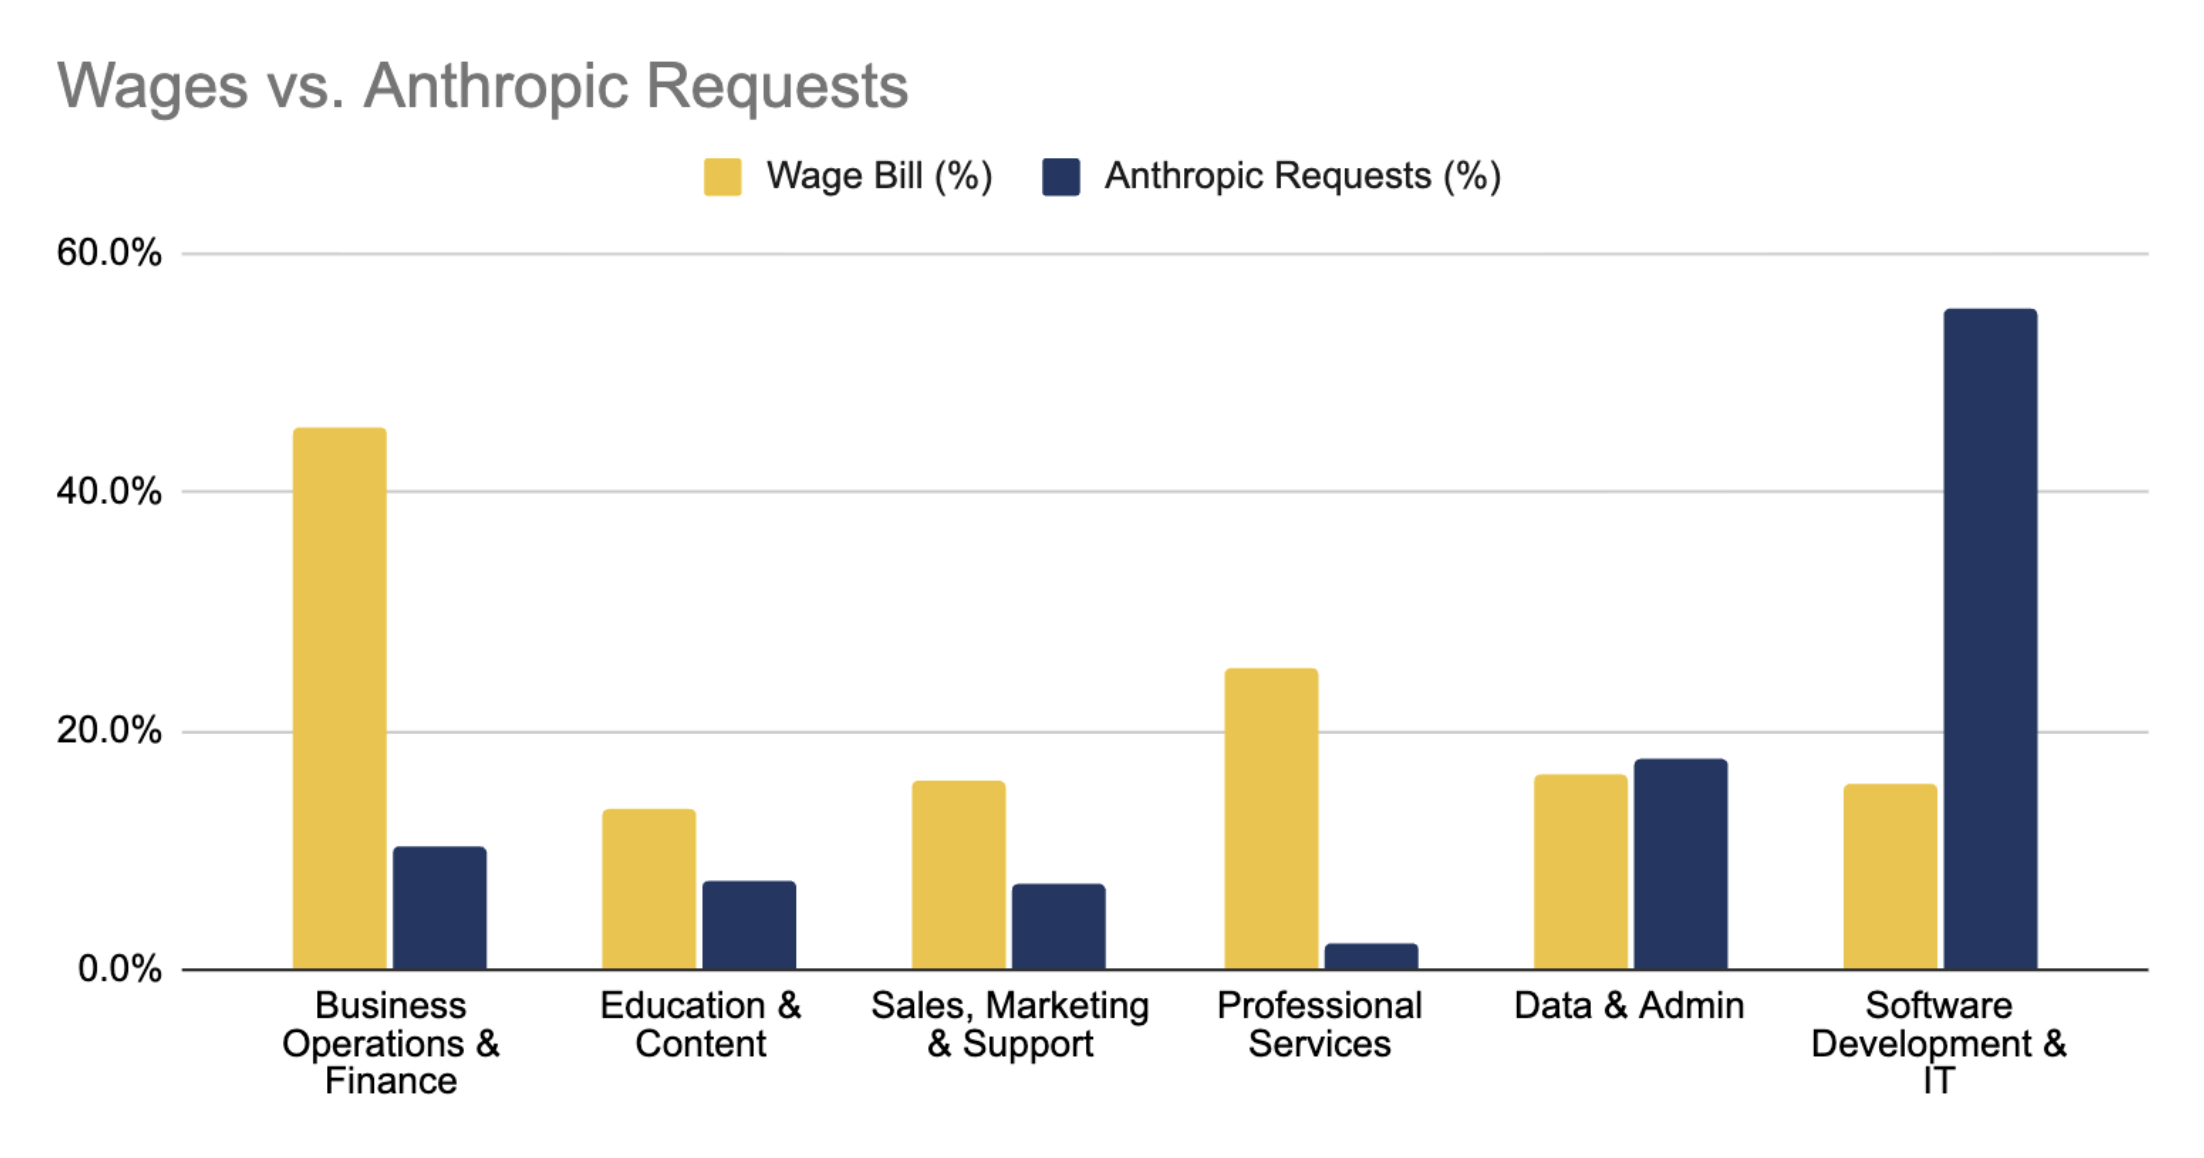
This graph is derived from:
The Bureau of Labor Statistic's OWES (Occupational Employment and Wage Statistics) survey. This supplies the wage bill for ~830 occupations across 22 sectors, of which we deem 13 “white collar”.
The Anthropic Economic Index (raw data here), a quarterly research publication in which Anthropic maps a sample of approximately one million Claude conversations, covering both direct (claude.ai) and API traffic. The data in this chart comes from November 2025.
Unfortunately, this chart has many limitations; it doesn't accurately represent the thing we care about!
Anthropic doesn’t categorise 36% of their token costs - where do these go?
Anthropic are mixing enterprise and consumer AI use
The categories used by Anthropic and the BLS’s labour codes don’t map well on to each other, not least because Anthropic is thinking in terms of tasks, and the BLS is thinking in terms of jobs. This is an important distinction, and Anthropic’s approach is helpful, but it makes it very difficult to compare the two; what tasks make up a job?
The Anthropic sample measures requests - but we actually about dollars and tokens. Large coding tasks, working across a codebase burn far more tokens than non-coding requests. As a result, this data underestimates the volume of spend going to software engineering.
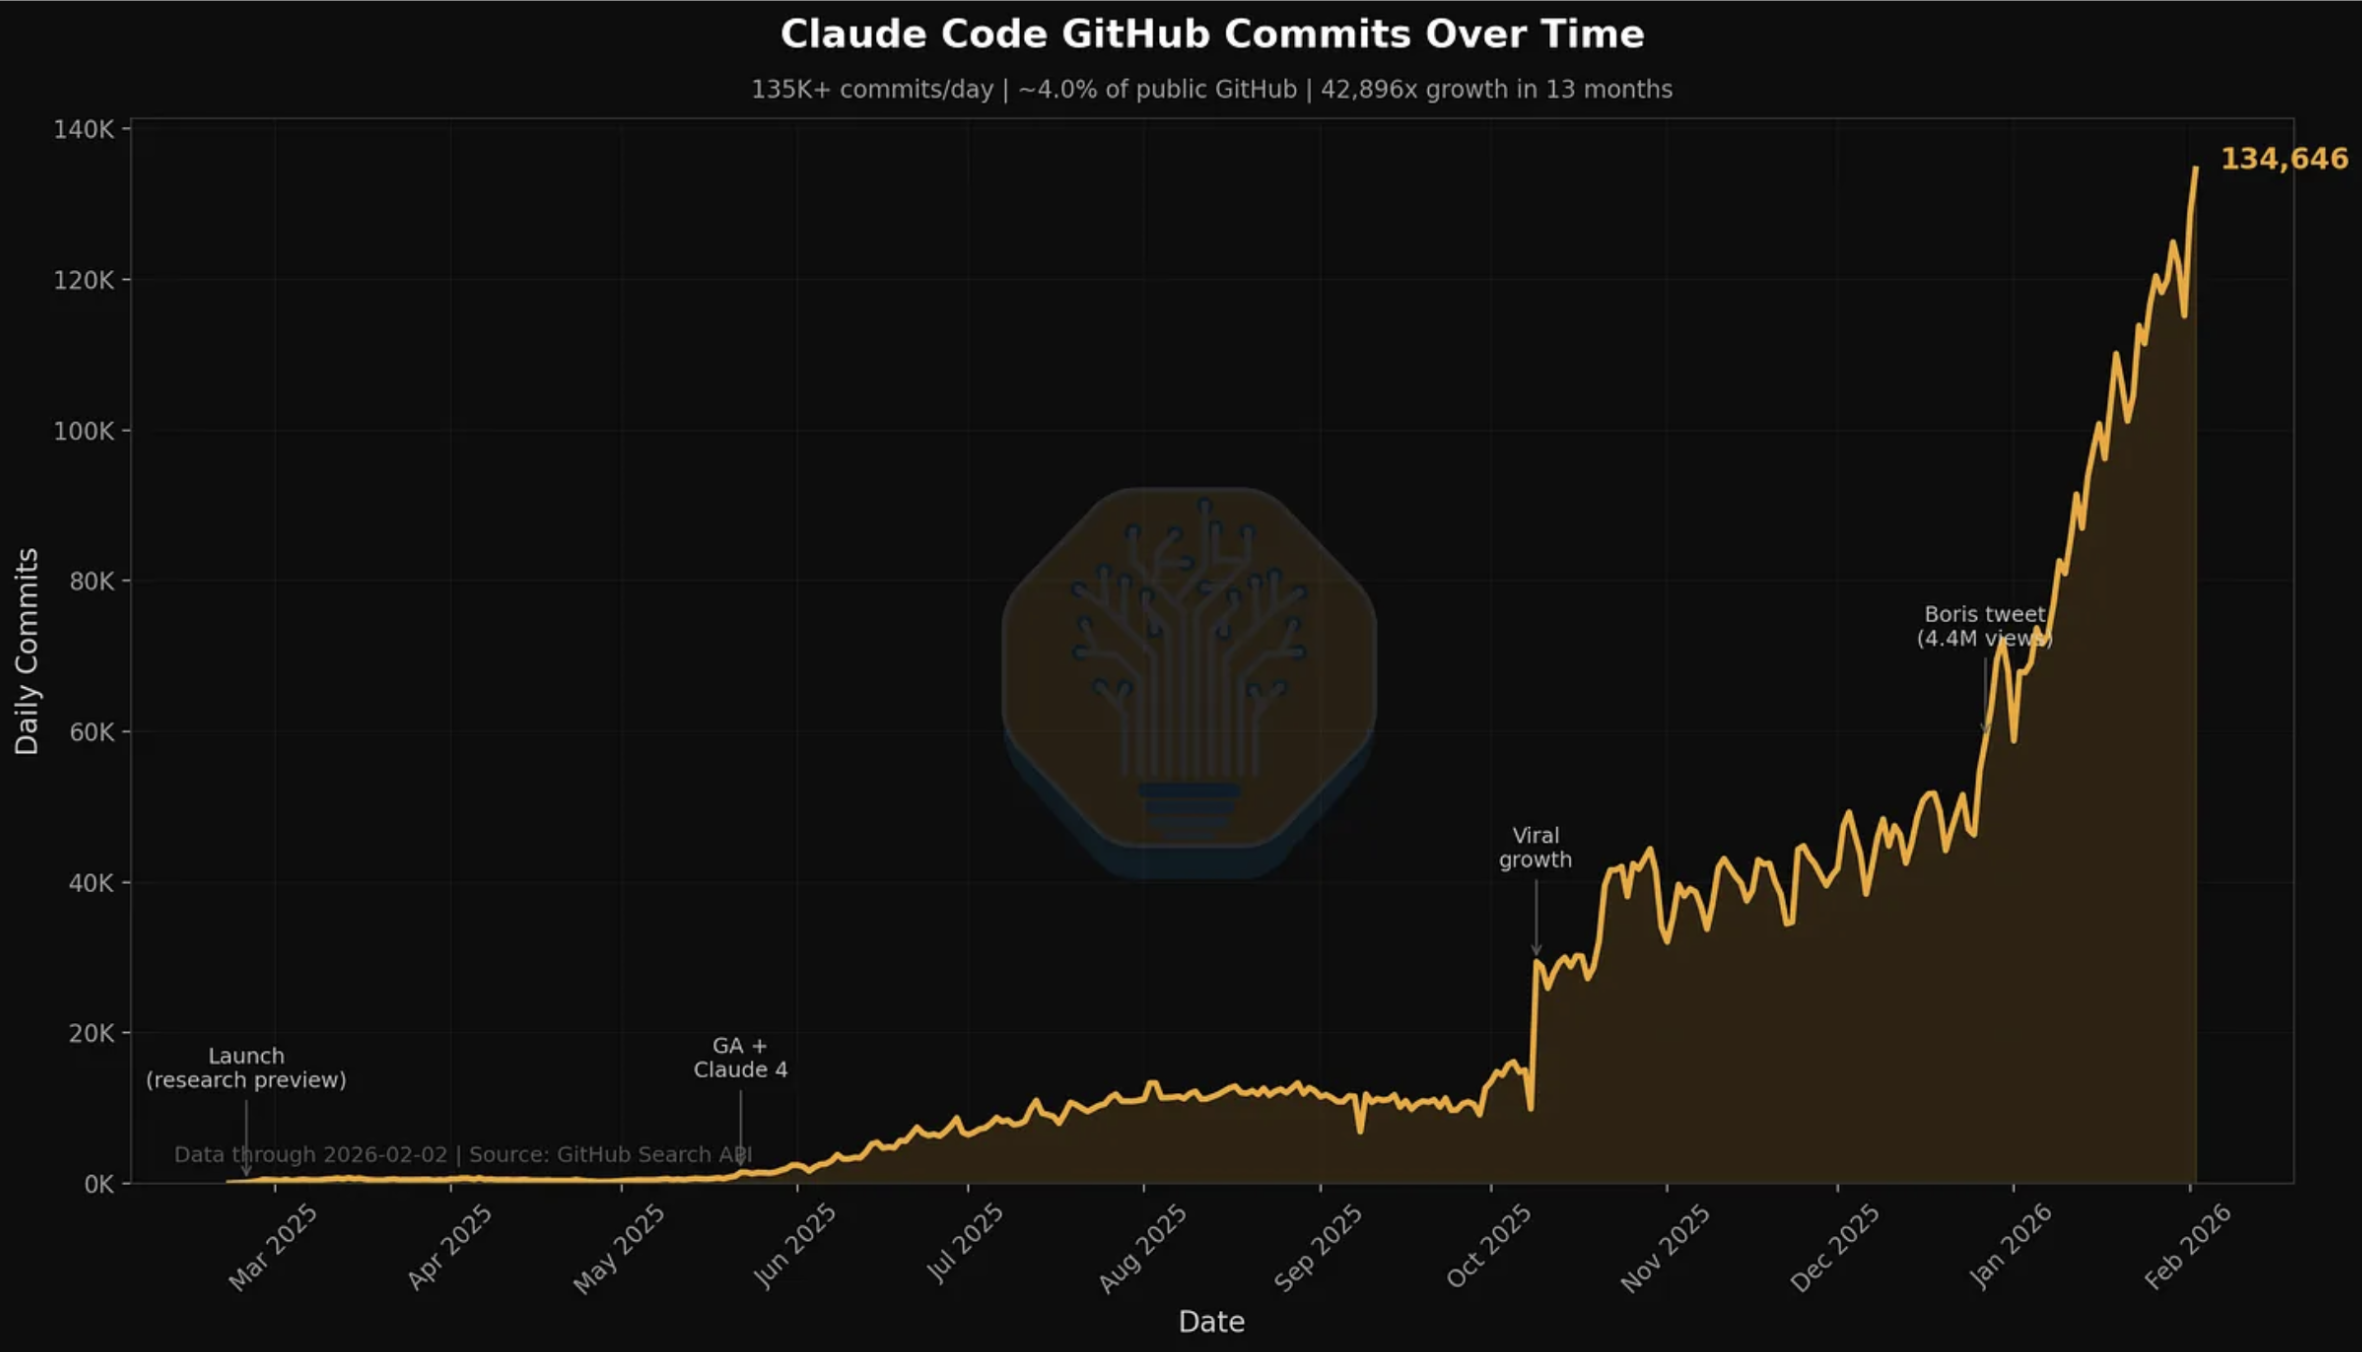
The Anthropic data comes from November 2025; at the end of 2025, Anthropic had a $9 billion run rate, but that increased to $19 billion by 3rd March 2026. Much of this increase will be attributable to software engineering, with the release of Opus 4.5 in November 2025 and the wide adoption of Claude Code creating a step change in the power of agentic coding.
h/t SemiAnalysis
Based on the last two points, it seems likely that our graph significantly underestimates the share of tokens going to software engineering. As such, the rest of the economy has a lot of catching up to do.
Nonetheless, as a way of measuring the ratio between human and AI labour in the economy, these datasets fall far short.
What we actually need is pretty simple: token spend at individual companies. How much does an organisation spend on licences and API credits? How many tokens are they consuming?
These numbers should be accessible to CFOs and CTOs; benchmarking them against revenue and labour cost gives an insight into exactly the shifts we care about.
We should have industry benchmarks and longitudinal studies. CEOs should be demanding them. Strategy consultants should be calculating and then selling them.
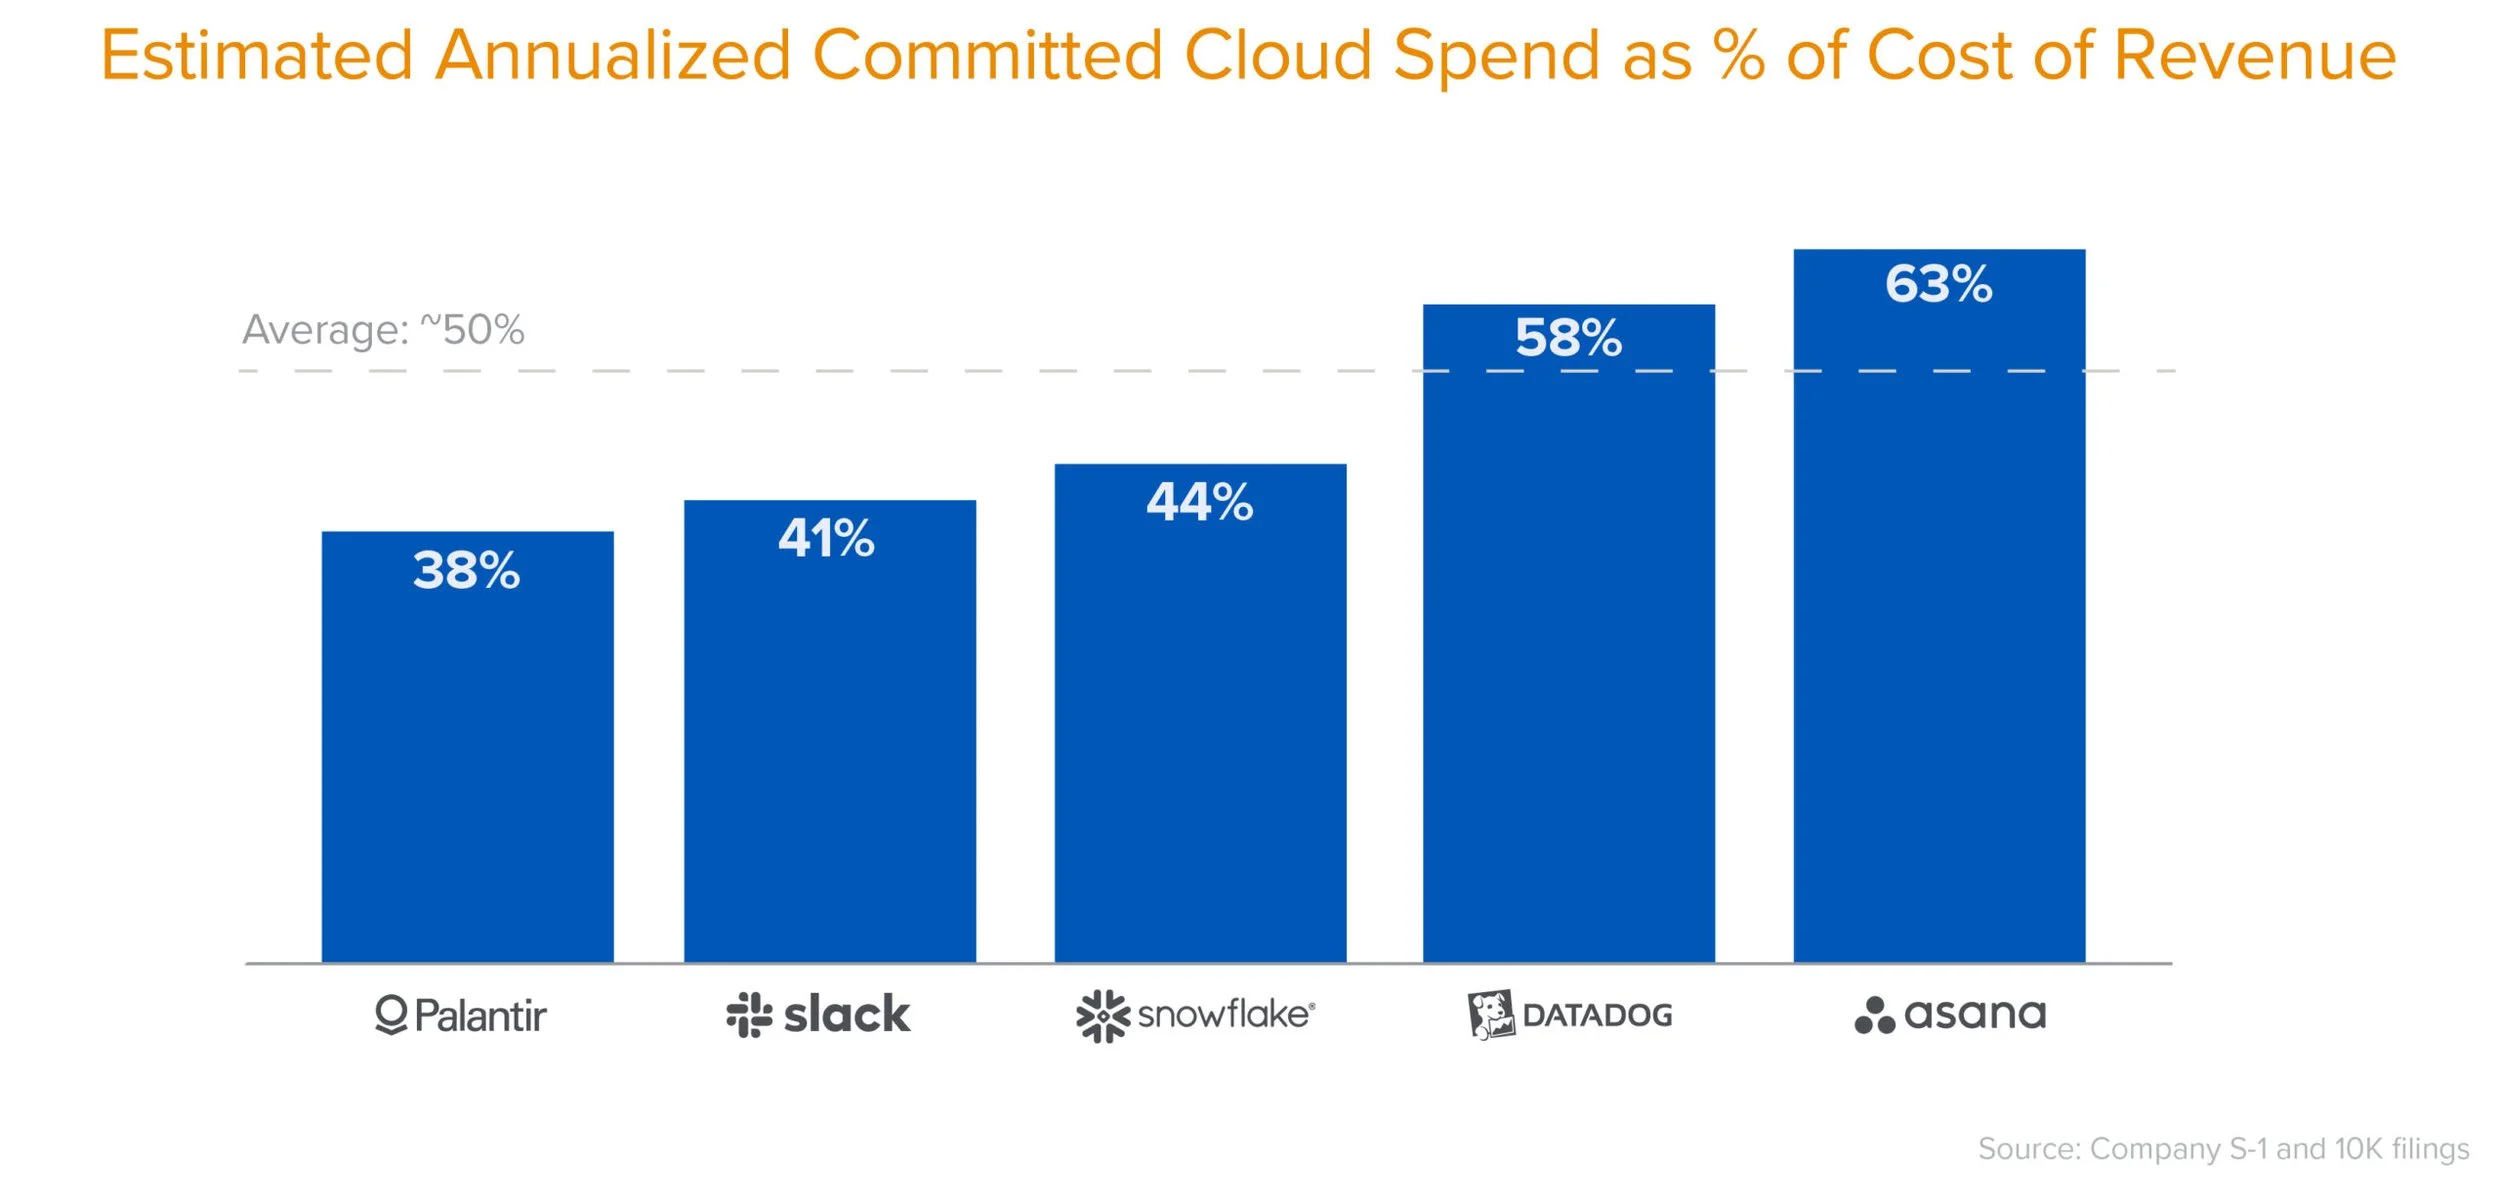
There’s a parallel with cloud. In 2021, Sarah Wang and Martin Casado from a16z analysed cloud costs at late-stage software companies. They estimated (based on anonymous interviews) that cloud costs were roughly 50% of COR for large software companies, and could be as high as 80%. While disclosures are still hard to come by, public companies may be required under the SEC’s Reg S-K Item 601(b)(10) to disclose cloud costs when they are “material contracts” - most notably, Figma's 2025 S-1 disclosed a $550m AWS contract.
If we could build a Meeker-style graph for tokens, we’d have a much better insight into the way AI is diffusing into the economy. In the mobile era, investors tracked attention and advertising. In the AI era, they track tokens. Investors, executives, and board members would all benefit from a better understanding of how their peers are spending on tokens. We’d love to see more data here.
One thing is clear: we’re still in the earliest innings. The market is not pricing in AI. It is perhaps not 2008 any more, but it might be 2011 or 2013.