ai-transformation.fyi
Last week, we published ai-transformation.fyi - an assessment of the major global private equity firms, and how we think their portfolio will fare in the context of AI. This meant researching and scoring over 5,000 companies to produce a genuinely singular dataset––the only one of its kind. All the data is free to download on the site.
Our feedback is that every major fund, and every major service provider in the private equity ecosystem, has taken a look at this; everyone wants to know how they (and their competitors!) are doing. The common sentiment was reflected by a software investor friend on Union Street in San Francisco - he said “I saw your thing: you really came for us, but you made a fair point.”
The research methodology would have been impossible nine months ago:
define a fuzzy, guideline-drived methodology, heavily incorporating AI research tools:
generate a list of funds
generate a list of portfolio companies
research each portfolio company
score each company according to our methodology
use Claude Code to define it in software allowing for massive parallelisation
run it!
share the results in a nice front-end.
AI tools unlock a completely new way of doing research - like giving Ben Graham a Bloomberg terminal. To illustrate the point - the other day, a friend told the story of how impressed his history thesis supervisors had been in 2020 with the breadth of his archival research; but all he had done was cmd-Fed for keywords through a large corpus. LLMs are an even bigger methodological innovation than cmd-F.
The key idea in our data is that the market is fleeing to safety - buying high-durability, low-opportunity businesses; but as a result, they’re selling the businesses who have the most opportunity to get AI right.
There are a few companies which will crush it: transforming what they do and how they work, vastly increasing quality and throughput, while entering new markets. Many others will die. The key is to identify which businesses are which!
Our approach used LLMs to generate a list of public comps, benchmarking each private company to a return profile over the last six months. Even without FactSet and CapIQ, you can get a pretty good understanding.
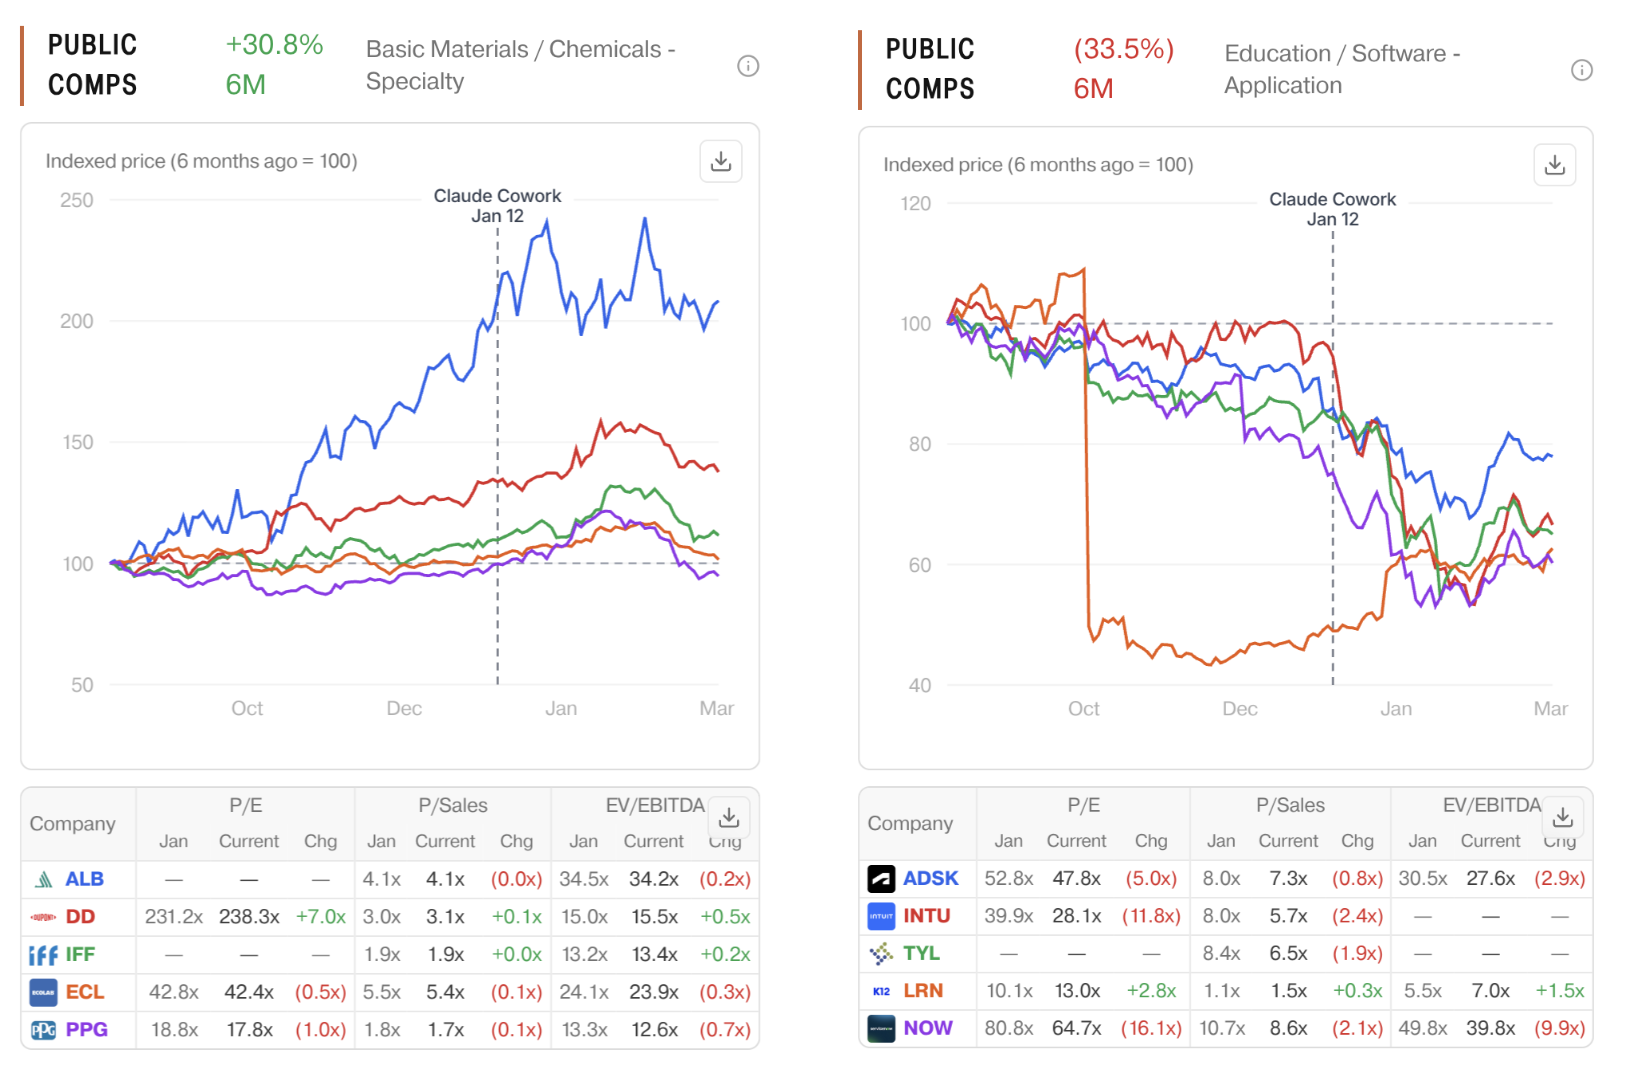
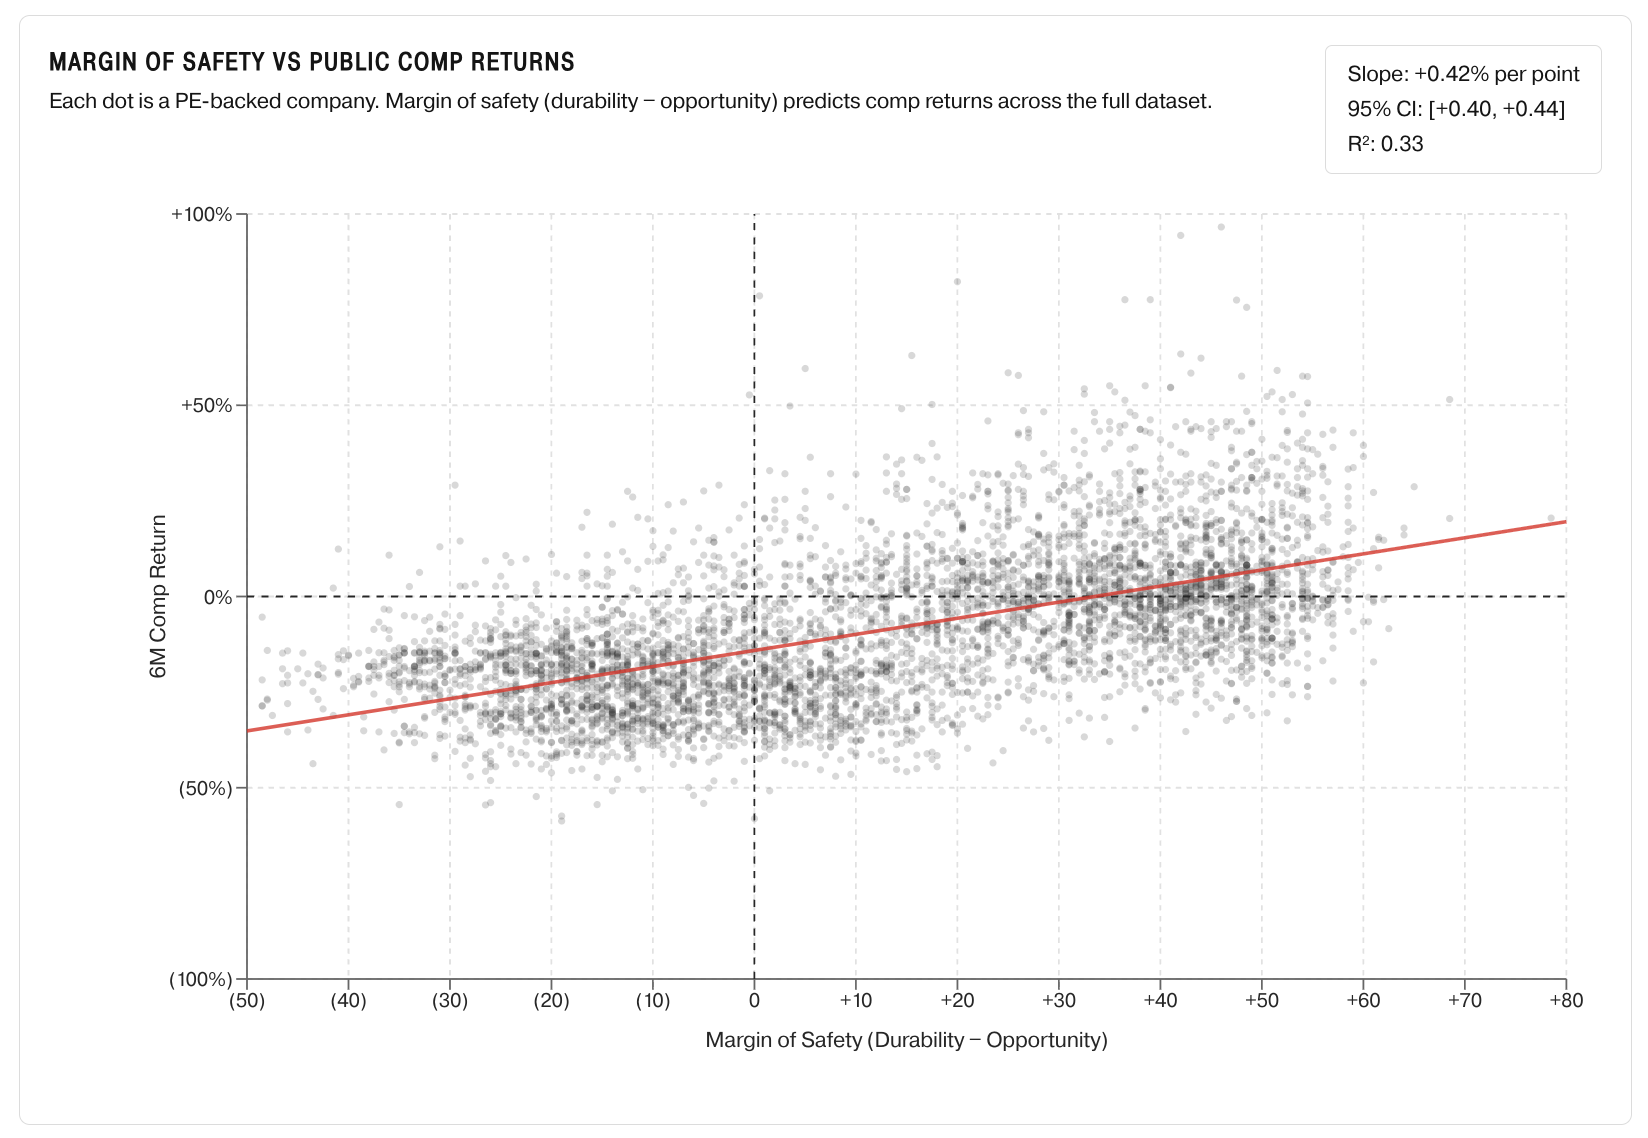
Interestingly, our approach maps closely onto public markets; the Margin of Safety score (durability - opportunity) correlates well with returns over the last six months.
Provocatively, someone turned our data into a Bloomberg terminal, ranking each fund; while this is fun (Vista/Thoma Bravo down 25%!!!), it does push the limits of what one can know outside-in; since we don’t know the size of each fund’s position, we can’t construct a proper weighted average.
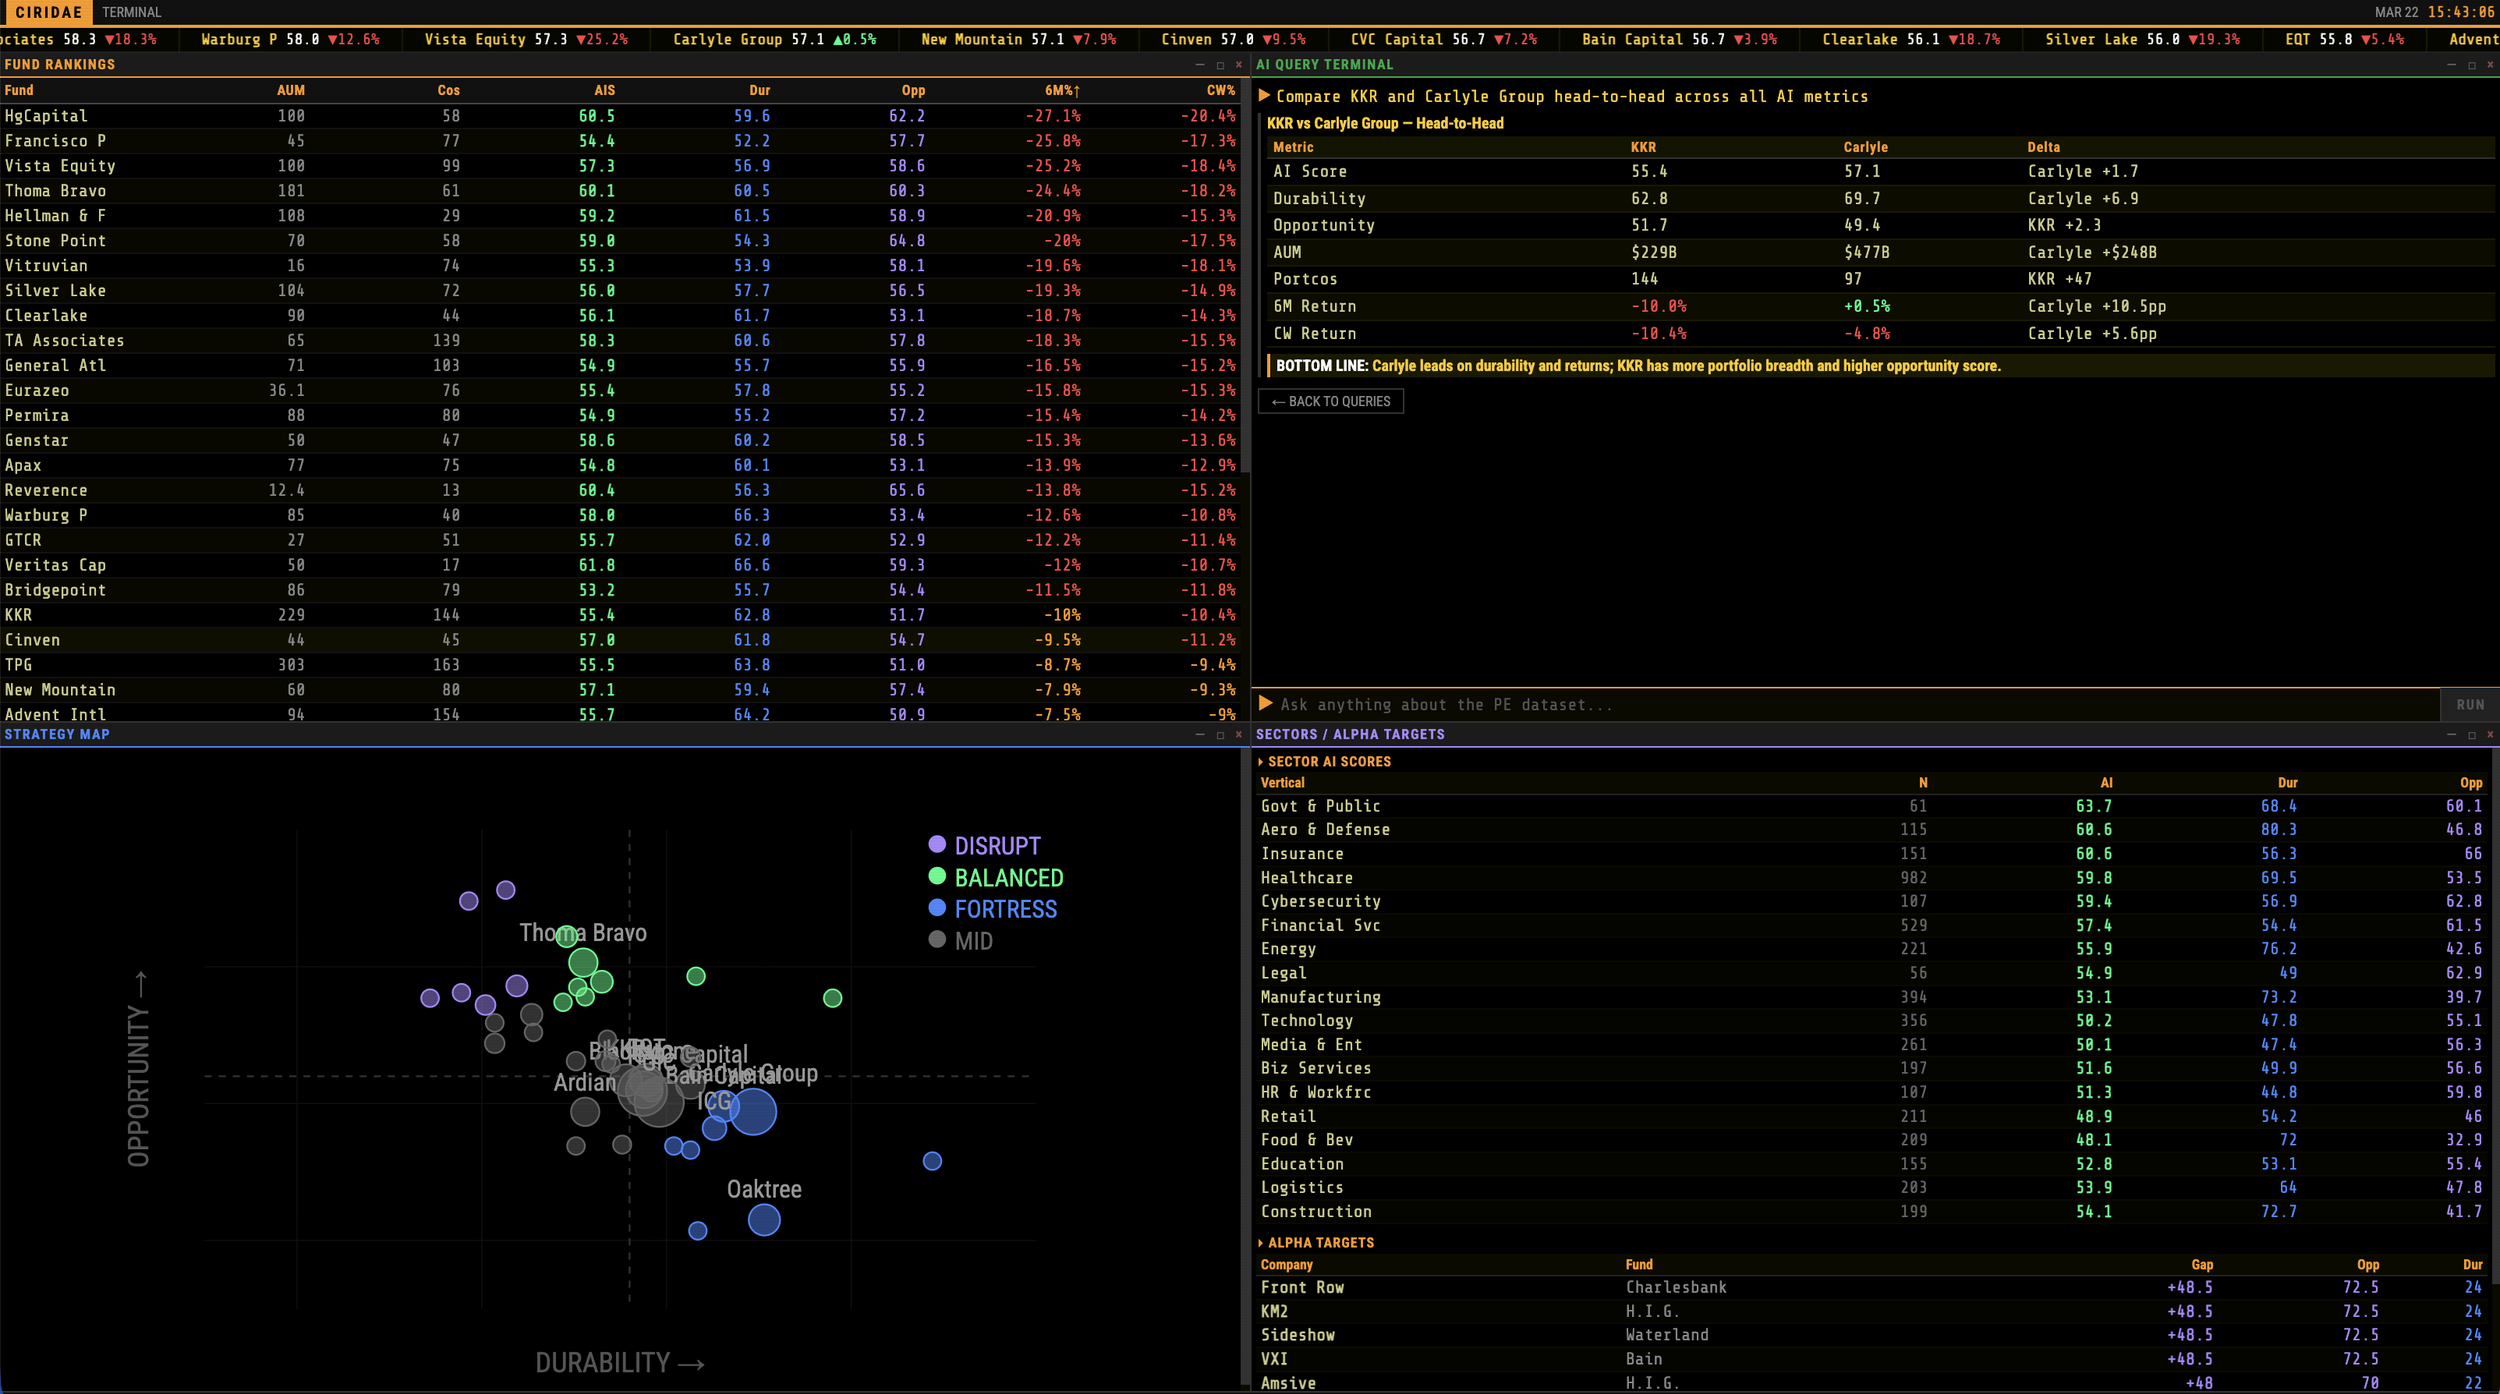
This is just one part of a broader point: when trying to research private companies systematically, you’re faced with “known half-knowns” and “unknown half-knowns” ( if you’ll forgive me the ugly framing).
Data points like revenue, EBITDA, multiple, employee count, engineer count, open positions, and AI initiatives can, in some cases, be measured outside-in; for example, UK private companies (especially FCA-regulated intermediaries!) make disclosures on Companies House that go far beyond anything an American company would be willing to make public; and so you find yourself with a patchwork of data collected from uncertain sources.
Ultimately, we had to just exclude this incomplete data from our analysis, on the basis that we couldn’t find it for every company, and we couldn’t easily verify it when we did find it.
The same is true of the list of deal partners; it’s difficult to know who worked on a deal! As such, we made the decision to hide the unreliable (but fun!) data in the UI, to avoid jumping to conclusions about who has been doing well (or badly).
If this sparks your curiosity - get in touch! felix.stocker@gmail.com